|
Factoids
RABORESEARCH: GRAIN DEMAND BOOMS IN EASTERN SUB-SAHARAN AFRICA
Source: Rabobank news release
Growing population drives grain consumption
ESSA comprises 22 different economies with a current population of 520 million, which is projected to reach 705 million by 2035. This will increase the demand for white corn, the main staple food in the region. However, other grains are also gaining popularity, such as wheat across the entire region and rice in Uganda, Tanzania, and Madagascar. According to Vito Martielli, Senior Analyst - Grains & Oilseeds at Rabobank, urbanization, income growth, and dietary changes will also fuel the demand for wheat, especially in large cities like Nairobi, Kampala, Dar es Salaam, and Lusaka.
Trade patterns vary across commodities
The region is not self-sufficient in grains and relies on different sources of imports, depending on the commodity. Wheat trade is a global business, while rice trade is mainly between ESSA and Asia. Corn and tapioca are mostly traded locally within ESSA.
Grain imports will increase, while some countries will improve self-sufficiency
The report predicts that the region's eight largest economies will need an additional 2 million to 3 million metric tons of wheat imports by 2035, in a conservative scenario. However, this growth will differ among countries, depending on their production outlook. Some countries, such as Zambia and Zimbabwe, have high yields of wheat and could become net exporters by 2035. Others, such as Ethiopia, the largest wheat consumer and producer in the region, have potential to increase production but not enough to meet demand. Kenya, the largest white corn importer in the region, is trying to improve its self-sufficiency by opening up to genetically modified commodities and expanding irrigation access for farmers.
Key factors and opportunities for growth
Martielli outlines several factors and opportunities that could enable growth in the region. These include improving transport and logistics infrastructure to facilitate trade, enhancing farming businesses to boost local production, and supporting long-term policies that foster private-public partnerships. There are also business opportunities in grains trade, ports and logistics infrastructure, and milling. The demand and supply gap will create advantages for wheat importers, traders, and financiers. Feed grain imports could also rise as animal feed demand grows in the medium to long term. Investments are needed to improve the quality and capacity of logistics and storage facilities in key port hubs and inland areas, as well as post-harvest storage infrastructure, in order to seize these opportunities. Transport infrastructure will also require project finance investment products. Milling capacity will expand, driven by local and regional players, as well as newcomers in some markets. Strategies for geographical expansion, diversification, and/or consolidation will generate demand for mergers and acquisitions.
by Tyne Morgan, AgWeb.com
USDA's first farmer survey-based yield estimate offered few surprises, but analysts say the yield estimate might already be out of date due to recent rains. USDA also made more cuts to demand as the export picture remains sluggish.
According to USDA's August Crop Production report, USDA-NASS made cuts to the national yield estimate.
Corn yield: 175.1 bu. per acre vs. 177 bu. per acre in July
Soybean yield: 50.9 bu. per acre vs. 52 bu. per acre in July
Wheat yield: 45.8 bu. per acre vs. 46.1 bu. per acre in July
The Yield Debate and Timing of the August Survey
The method used to estimate yield changes in August each year if different from how yields are calculated earlier in the growing season. Up until this month, the World Board handled the yield estimates and produced those via a model they use every year. This month, NASS takes the reins, conducting a farmer survey which asks farmers for crop estimates based on August 1.
Analysts say the only problem with that is one of the biggest rain events of the year fell after August 1 this year.
To read the entire report click here.
U.S. consumers spent an average of 11.3% of their disposable personal income (DPI) on food in 2022, a level not observed since the 1980s. DPI is the amount of money U.S. consumers have left to spend or save after paying taxes.
Consumers spent 5.62% of their incomes on food at supermarkets, convenience stores, warehouse club stores, supercenters, and other retailers (food at home) in 2022 and 5.64% on food at restaurants, fast-food establishments, schools, and other places offering food away from home.
In 2022, the share of DPI spent on total food had the sharpest annual increase (12.7%). This followed an 8.2% decline, the sharpest annual drop in total food spending since 1967, during the first year of the Coronavirus (COVID-19) pandemic in 2020.
The recent volatility in spending was driven by consumers' sudden drop in eating out at the beginning of the pandemic followed by a return to food-away-from-home purchases as pandemic-related restrictions and concerns eased.
|

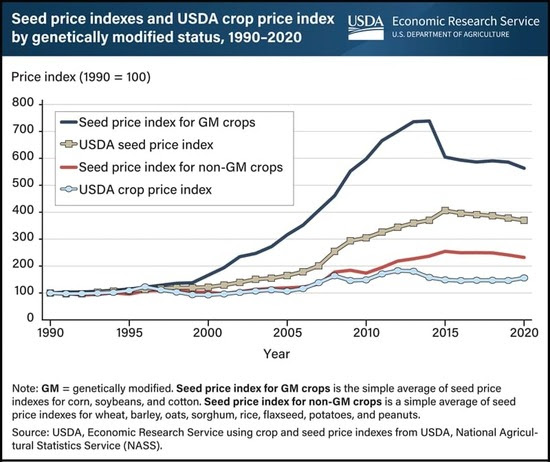 USDA REPORTS PRICES FOR GENETICALLY MODIFIED SEEDS HAVE RISEN MUCH FASTER THAN NON-GM SEEDS